Distribution
 |
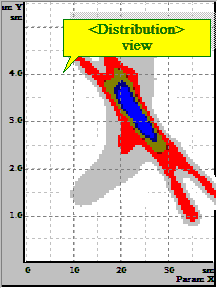
 The plot in <Distribution> view mode. The plot in <Distribution> view mode.
Density function is constructed on all points. The contribution
of each point is determined by its own density distribution function.
The contributions from different points are summarized proportionally
to number of points or proportionally to area of points.
The density distribution function of single points is assigned on
property page <Options><Density>. |
The color intensity of a cell is proportional to densities function.
Distribution is normalized on 100% at maximum. By default distribution of
density is constructed for points of each color.
Use this view mode to find and show density distribution picks. By
default brightness and color are proportional to density. Use logarithmic scale,
to increase contrast. It is useful for maximums searching. To change
view settings, go to property page <Options><Distribution> and select
quality and transparency.
Trick: Use button <Apply> as Preview.
Menu items available in all view modes:
- Show/Hide
regions with density in assigned ranges;
- Draw the distribution with provision for color of
points or summary.
- Draw color distribution or vectors of gradients.

á
